Menu
Close
I'm an AI Engineer who transforms complex challenges into intelligent solutions. With expertise in machine learning, deep learning, and natural language processing, I build production-ready AI systems that solve real-world problems. From conversational AI platforms to advanced NLP pipelines, I specialize in creating scalable, explainable AI applications that drive meaningful impact. My journey from data analysis to AI engineering has equipped me with a unique perspective on turning data insights into intelligent automated systems.
Here are some of my skills where I've turned knowledge into expertise, making things happen.
Expert in Python programming with extensive experience in AI/ML frameworks including TensorFlow, PyTorch, Scikit-learn, and Keras. I leverage Python's ecosystem for building end-to-end machine learning pipelines, developing neural networks, and creating scalable AI applications. Proficient in NumPy, Pandas, and other scientific computing libraries for data manipulation and analysis.
Specialized in developing and deploying machine learning models including supervised, unsupervised, and reinforcement learning algorithms. Experienced in feature engineering, model selection, hyperparameter tuning, and performance optimization. I build predictive models for classification, regression, clustering, and recommendation systems using various ML techniques.
Proficient in designing and training deep neural networks including CNNs, RNNs, LSTMs, and Transformers. I specialize in computer vision, natural language processing, and sequence modeling. Experienced with transfer learning, fine-tuning pre-trained models, and building custom architectures for specific AI applications.
Skilled in building robust data pipelines and ML infrastructure. Experienced in data warehousing, ETL processes, and database management with SQL and NoSQL systems. I implement MLOps practices including model versioning, automated testing, continuous integration, and deployment pipelines for production-ready AI systems.
Specialized in developing computer vision applications for image classification, object detection, and semantic segmentation. Expert in NLP tasks including text classification, sentiment analysis, named entity recognition, and language modeling. I work with OpenCV, Pillow, spaCy, NLTK, and Hugging Face transformers.
Experienced in deploying AI models on cloud platforms including AWS, Google Cloud, and Azure. Proficient in containerization with Docker, orchestration with Kubernetes, and serverless deployments. I build scalable AI APIs, implement model serving infrastructure, and ensure high availability for production AI systems.
Expert in optimizing AI models for performance, efficiency, and scalability. Skilled in model compression techniques, quantization, pruning, and knowledge distillation. I optimize models for edge deployment, reduce inference time, and implement real-time AI solutions while maintaining accuracy and reliability.
Proficient in creating compelling data visualizations and interactive dashboards using tools like Matplotlib, Seaborn, Plotly, and Streamlit. I transform complex AI model outputs and data insights into clear, actionable visualizations for stakeholders, enabling data-driven decision making in AI projects.
Passionate about staying current with AI research and implementing cutting-edge techniques. I experiment with new architectures, read research papers, and adapt novel approaches to solve business problems. Experienced in A/B testing for AI systems, statistical analysis, and continuous model improvement.
Here are some of my projects where I've turned code into cool, functional stuff.
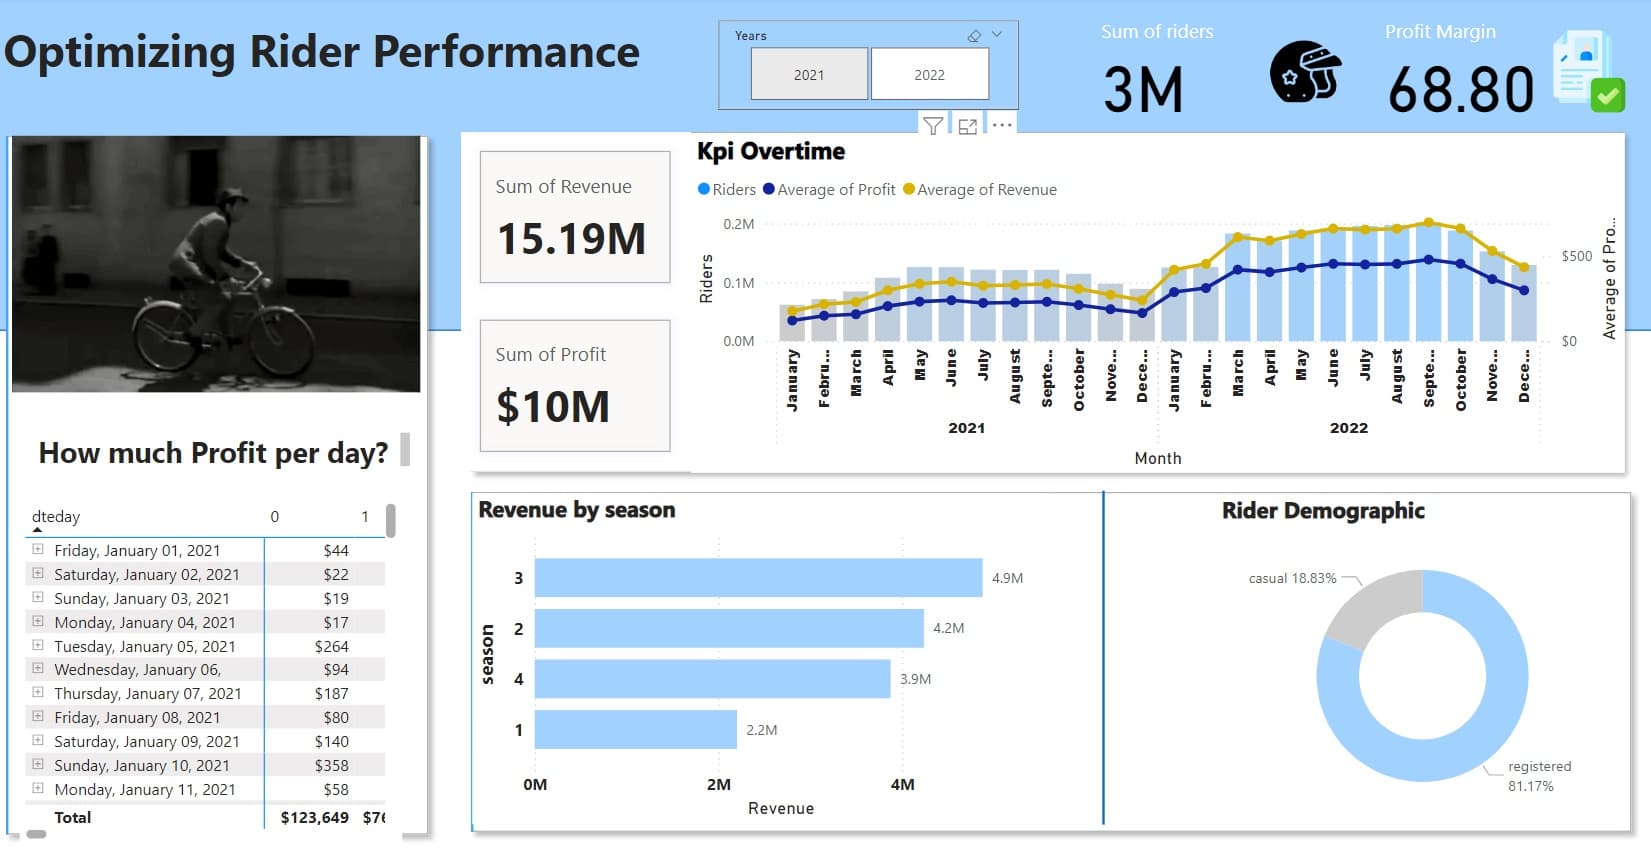
This project focuses on improving rider efficiency, maximizing profitability, and detecting anomalies in a bike-sharing system using advanced data analysis techniques. By leveraging SQL for data processing, predictive modeling, anomaly detection, and integrating Power BI for visualization, this project delivers actionable insights to optimize operational strategies.
An advanced conversational AI system built with transformer models and Retrieval-Augmented Generation (RAG). Features semantic search, context-aware responses, and integration with multiple data sources for accurate, real-time question answering across various domains.
In this project, I performed an exploratory data analysis (EDA) focusing on Market Basket Analysis and Item-Based Collaborative Filtering. The objective was to uncover patterns in customer purchasing behavior and generate personalized product recommendations for the Bronze Segment.
A production-ready computer vision system built with TensorFlow and PyTorch for real-time image classification. Features custom CNN architectures, transfer learning, data augmentation, and deployed as a scalable REST API with 95%+ accuracy on multiple image categories.
An intelligent NLP system that predicts and generates contextually relevant video game text using machine learning. Built with TF-IDF vectorization and Multinomial Naive Bayes, featuring emotion-aware text generation and real-time sentence completion capabilities.
This project develops a data analytics and reporting application for analyzing the Powerlifting Database . It uses ETL processes to transform and load data into a PostgreSQL database.
The repository provides detailed analysis using factor analysis and linear regression on a dataset related to the dimensions of perfectionism. This type of analysis is useful for understanding underlying factors in complex datasets and predicting outcomes based on identified relationship that requires latent variables and making predictions.
Have a question or want to work together? Send me a message using the form.
Email
Socials