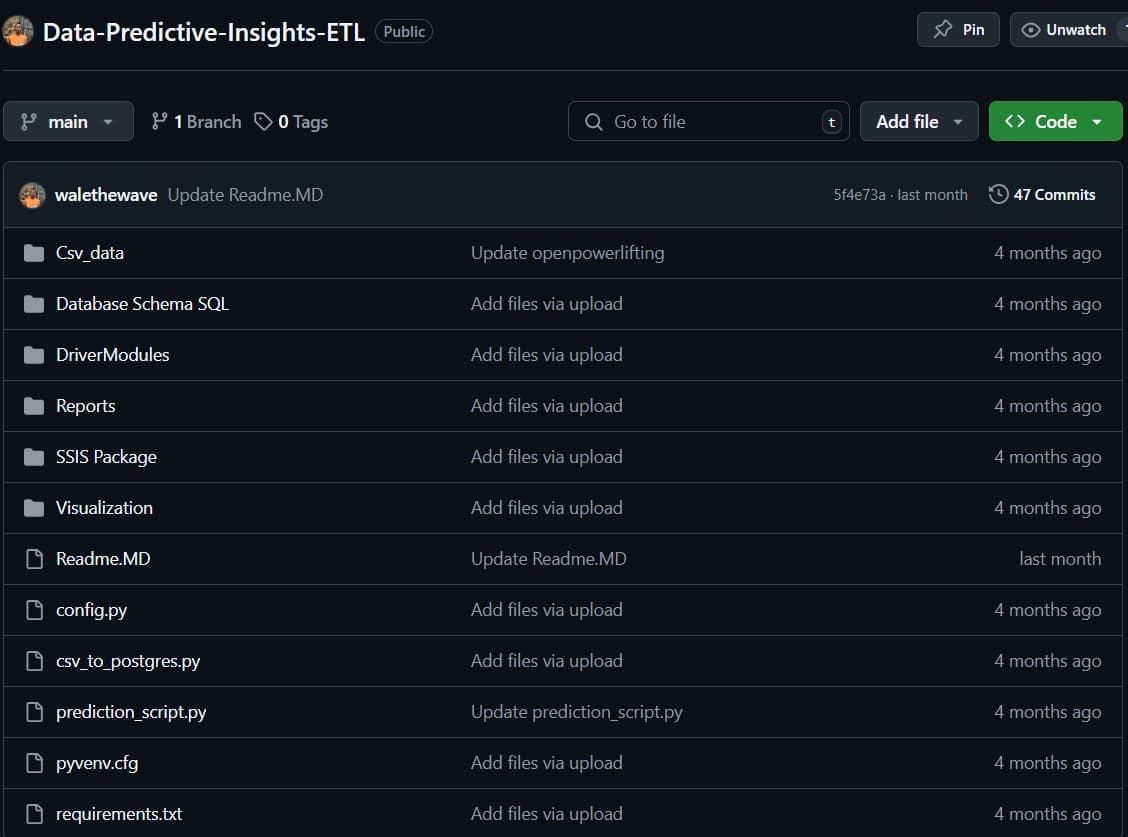
#Data Predictive Insights ETL Pipeline
This project builds a full ETL pipeline for the OpenPowerlifting dataset — raw competition CSVs in, a normalized PostgreSQL database and a trained predictive model out, with Power BI dashboards on top for coaches and athletes to actually use.
#What It Does
Takes raw powerlifting meet data (athletes, meets, lifts across Squat/Bench/Deadlift) and runs it through a proper Extract-Transform-Load pipeline into a relational schema, rather than dumping a flat CSV into a table. On top of that, a scoped linear regression model predicts total weight lifted from age, bodyweight, and equipment class.
#ETL Pipeline
- Extract: Raw CSVs (
openpowerlifting.csvand a 2024 snapshot) from Kaggle - Transform: Cleans weight-class formatting, fills missing
Tested/MeetStatevalues, derivesTotalKgfrom the three lift totals - Load: Inserts into a normalized PostgreSQL schema — separate
Athlete,Event,Equipment,Division,WeightClass,Meet,Lift, andPerformancetables linked by foreign keys, not one wide table - Error handling: Rows that fail to insert are caught and written to a dedicated
ProblematicRowstable (row index, error message, raw data) instead of crashing the load or silently dropping data - Alternate path: An SSIS package (
openpowerlifting.dtsx) implements the same load as a visual ETL pipeline, alongside the Python script
#Predictive Modeling
Rather than modeling every lifter and event type together, the regression is scoped to a coherent population: male competitors in full SBD (Squat-Bench-Deadlift) meets, with unrealistic outliers filtered out (age < 79, bodyweight < 153.27kg, all three lifts > 0). Mixing sexes, equipment classes, and event types into one model would blur the signal — a bodyweight-adjusted total means something different for raw vs. equipped lifters.
- Model: Linear Regression in a
scikit-learnPipeline(StandardScaler on numeric features, one-hot encoding onEquipment), predictingTotalKgfrom age, bodyweight, and equipment type - Result: R² = 0.411 (explains 41.1% of variance), RMSE ≈ 114kg — reported plainly as a baseline, not oversold
- Output: Auto-generates a
.docxreport of the results alongside the raw metrics
#Solution Architecture
Raw CSV (Kaggle OpenPowerlifting export)
  → Transform (cleaning, TotalKg derivation, weight-class normalization)
  → Load into normalized PostgreSQL schema
      (Athlete / Event / Equipment / Division / WeightClass / Meet / Lift / Performance)
      failed rows → ProblematicRows table, not dropped
  → Power BI dashboards (query the normalized schema directly)
  → Separately: scoped subset (male, SBD, outliers removed)
      → sklearn Pipeline (scale + one-hot encode) → Linear Regression
      → R² / RMSE evaluation → .docx report
Key engineering decisions:
- Normalized schema over a flat table — splitting athletes, meets, equipment, and lifts into linked tables makes the data queryable the way an analyst would actually ask questions ("average total by weight class," "performance trend by meet"), instead of repeating athlete/meet metadata on every lift row.
- A dead-letter table for failed inserts — rather than letting a single malformed row abort the load or silently vanish, failed inserts are captured with their error message and raw data in
ProblematicRowsfor later inspection. Small addition, but it's the difference between a pipeline that fails loudly in a debuggable way and one that just loses data. - Modeled a coherent subset, not the whole dataset at once — restricting to male SBD competitors before training keeps the regression's inputs (age, bodyweight, equipment) meaningfully comparable across rows. A model trained across mixed sexes, equipment classes, and partial-meet event types would average over populations that don't actually share the same relationship between bodyweight and total.
- Reported R² and RMSE honestly — 41.1% variance explained and a ~114kg average error are stated as what they are: a usable baseline for spotting trends, not a precision prediction tool.
#Why This Matters
Raw competition data is only useful once it's queryable and trustworthy. This project treats the ETL step — schema design, error handling, data quality — as seriously as the modeling step, because a predictive model built on a shaky data layer is only as good as the pipeline feeding it.